Using KSysGuard
System monitor tool for KDE
Overview
KSysGuard is a very flexible tool that ships with the KDE 5* desktop for monitoring and managing your workstation using available sensors.
This post intends to replace the already-very-gentle learning curve with a “just look at the pictures, man!” guide. I will walk you through adding a new monitoring tab as I recently did to monitor my CPU and GPU temperatures on my laptop.
The use-case
Recently I bought a new System76 laptop for development work. And while it does a great job as a mobile development workstation, it also has caught the attention and admiration of both Gabe Newell’s closest friend and advisor - my 9-year-old son - and my 17-year-old nephew. The interest may be due to the 100% sRGB IPS panel, GSYNC, the Nvidia GTX 970M GPU, a wicked-fast Skylake 14nm Core i7 CPU, a blazing PCI-e SSD, or well-stocked Steam client. Or maybe all of the above.
Whatever the case, the laptop has seen a lot for gaming sessions when daddy isn’t running WebStorm, and the cooling fans have been spinning quite a bit - although thankfully they aren’t obtrusive. However, I did want to make sure the hardware wasn’t being pushed to thermal limits.
Installation
KSysGuard has been around for a very long time and is very mature, yet I always have had the RonCo Rotisserie mentality of set it and forget it. This time, I decided to document my steps for posterity.
Before I started I reviewed the Kubuntu guide. I made sure that the
Kubuntu backports repository was enabled so we would have the latest KDE bug
fixes and features. If you want to use KSysGuard and it isn’t already
installed, sudo apt-get install ksysguard should do the trick.
Configuration
We may either type ksysguard at the command line, or use the application
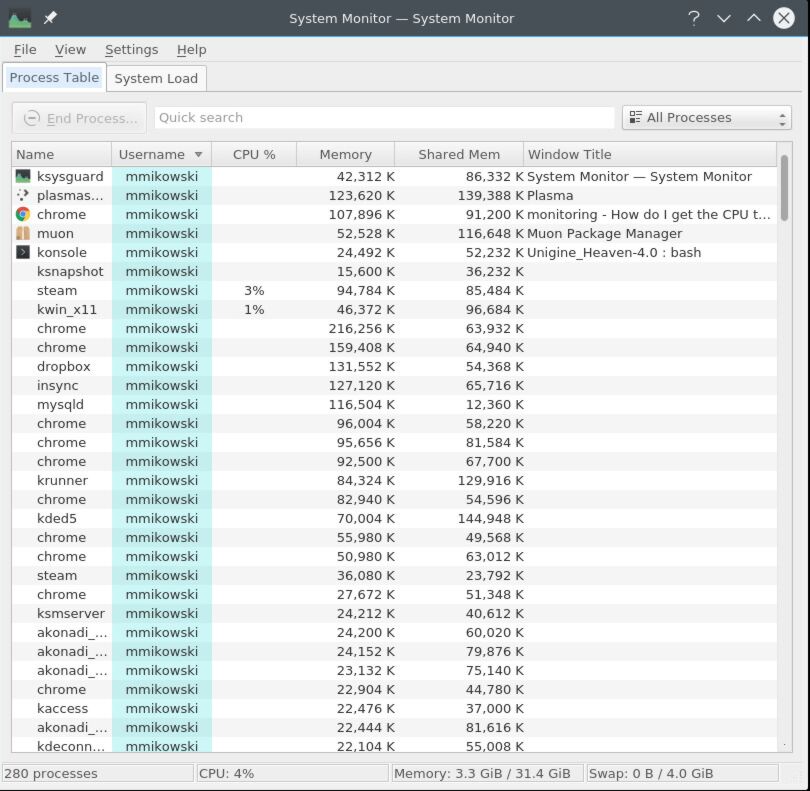
menu to launch KSysGuard under Applications > System > System Monitor. When the application opens, we should see a Process Table tab
similar to the image below. This is a nice graphical process manager,
but not the focus of our work here today.
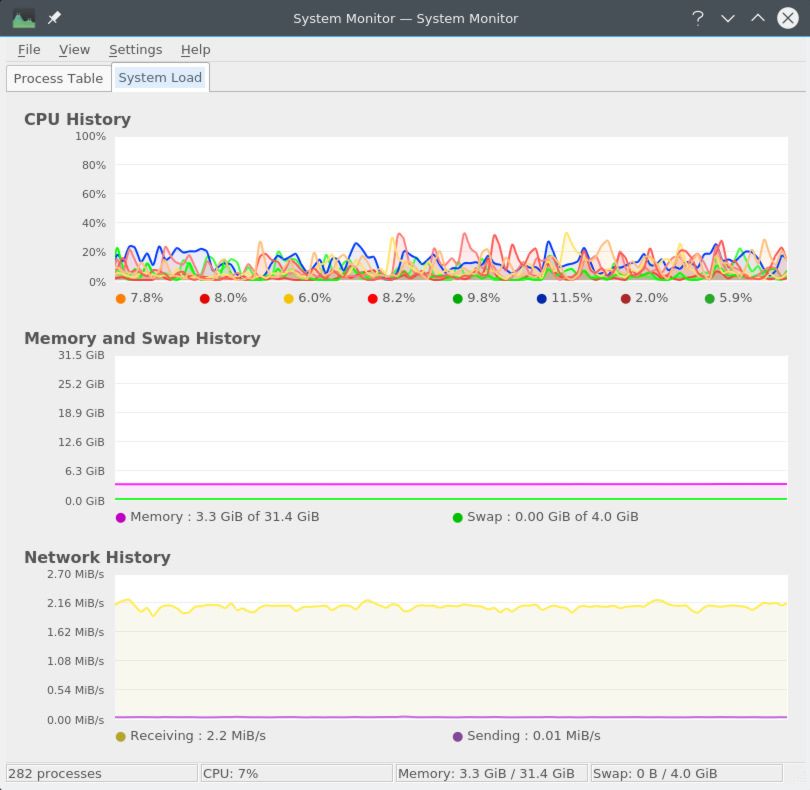
The other default tab is the system load. Here we see usefull information about CPU, memory, and network load:
If we want a new tab that shows temperature information, we can
add one by selecting File -> New Tab...:
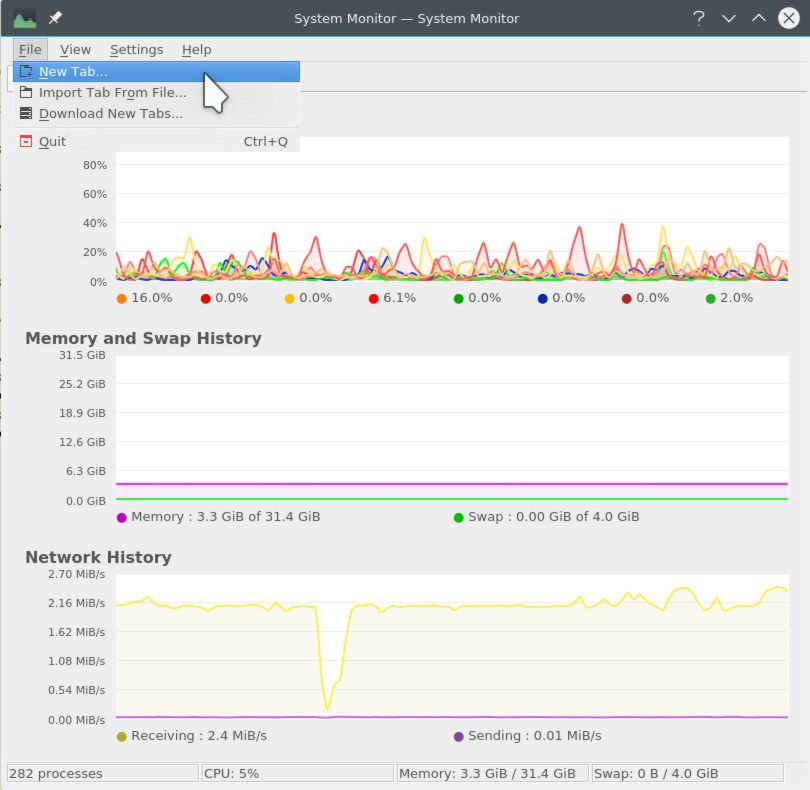
Notice we could have downloaded or imported tabs. This is handy for sharing configurations on many computers. Something to keep in mind.
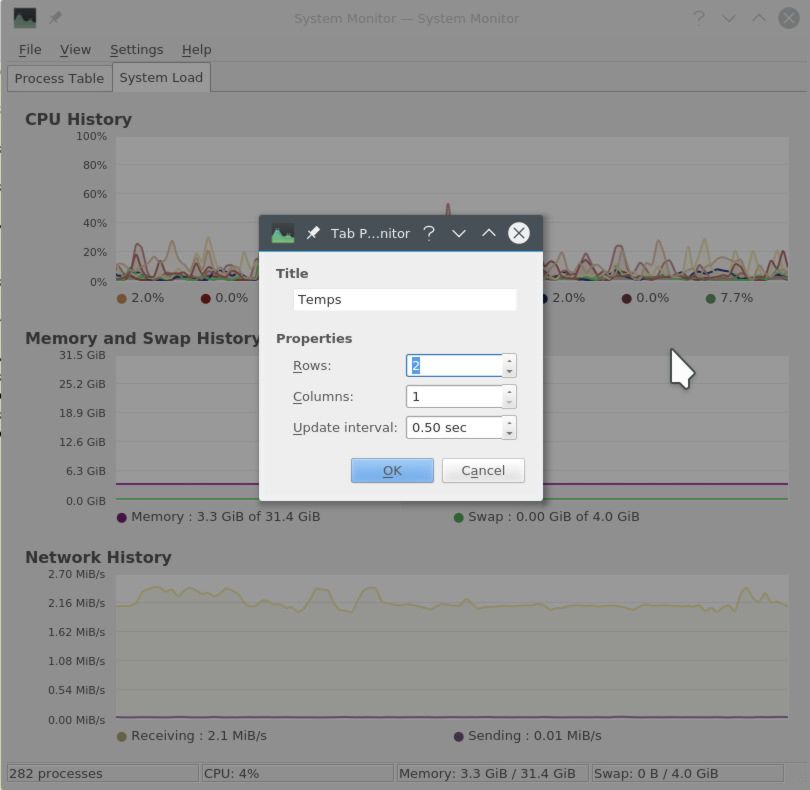
The image below shows the default configuration for our new tab.
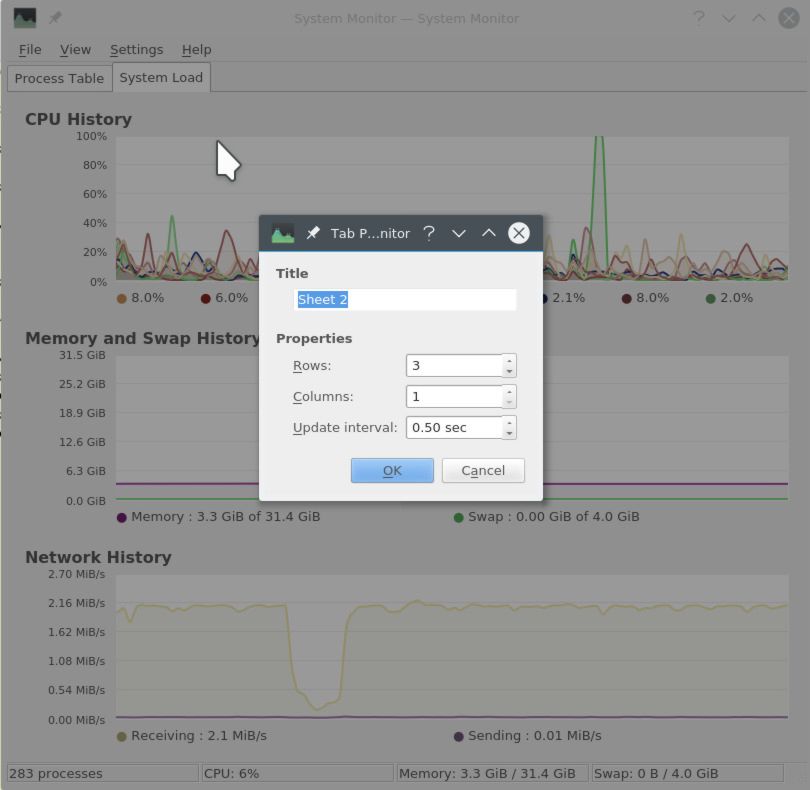
We modify our tab configuration to give it a more meaningful name, Temps;
and we specify a 2-row, 1-column layout.
Once we enter our configuration, we are presented with our layout of graphs on the left, and an array of sensors on the right:
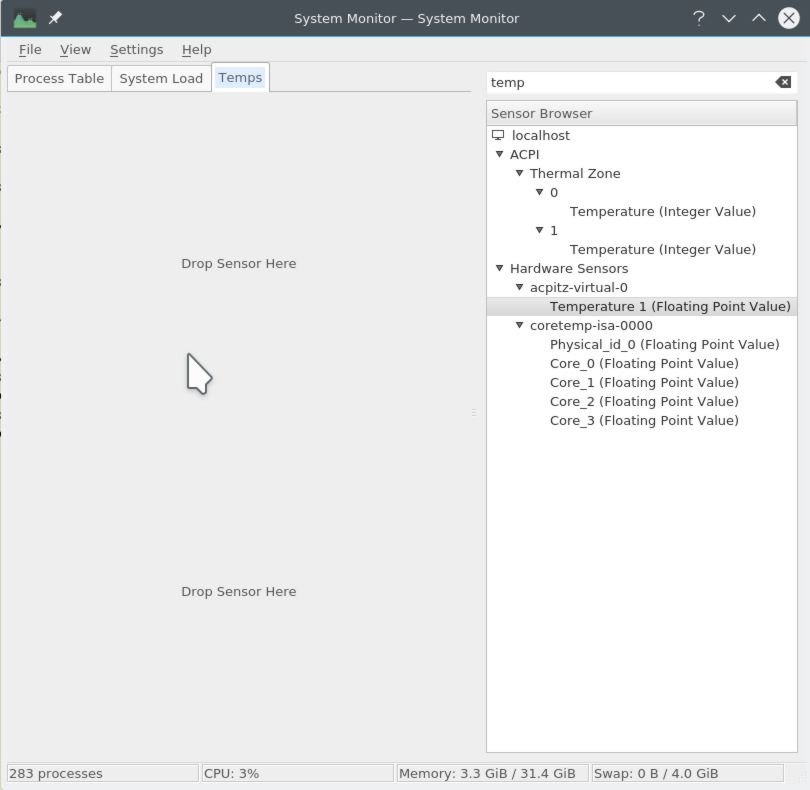
The graphs are initially empty, with simply the words Drop Sensor Here. We
can do just that to get our first graph in place.
Add the CPU graph
The first graph we will tackle will show CPU temperatures. We can take
our Physical CPU temperature sensor and drag it on the first Drop Sensor
Here we see. The available sensors will vary depending on the computer
and the software we have installed.
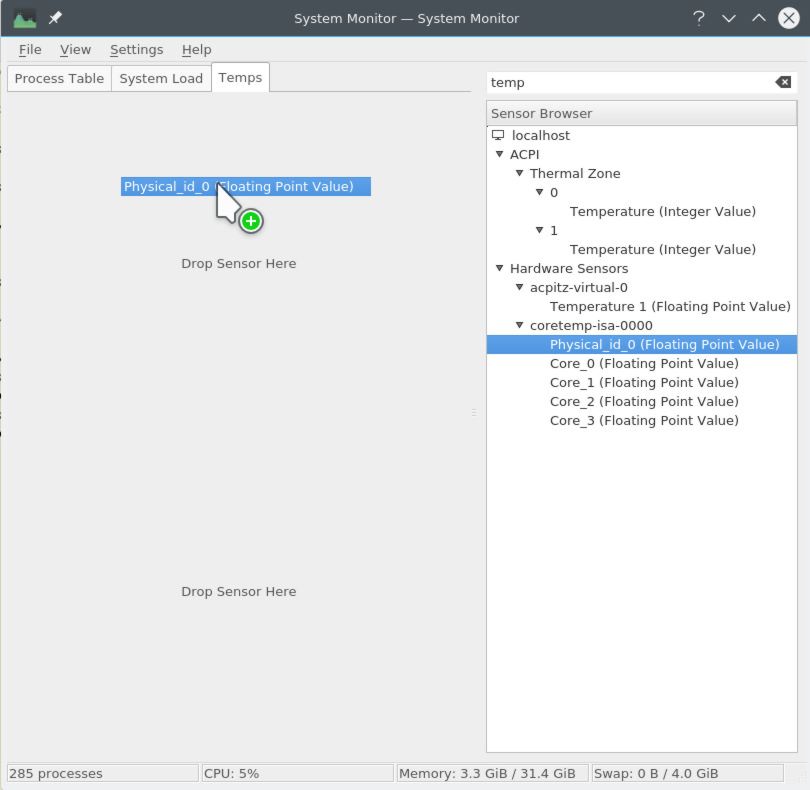
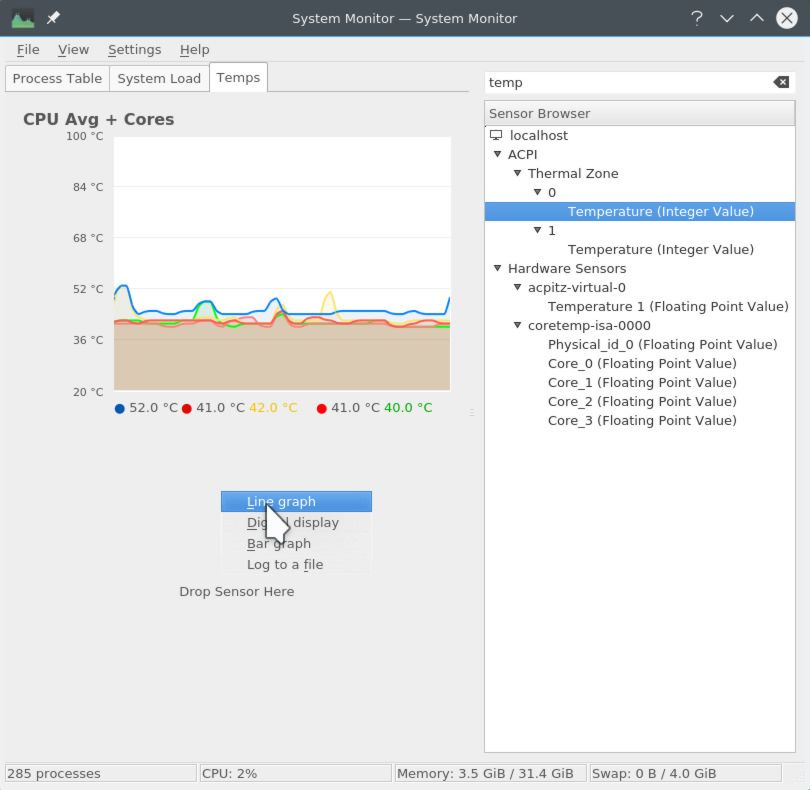
Once we’ve dragged a sensor onto the graph area, we can specify the type of graph we’d like to see. Generally, line graphs are best for temperature, as not only do we see current temperature, but we can also spot trends.
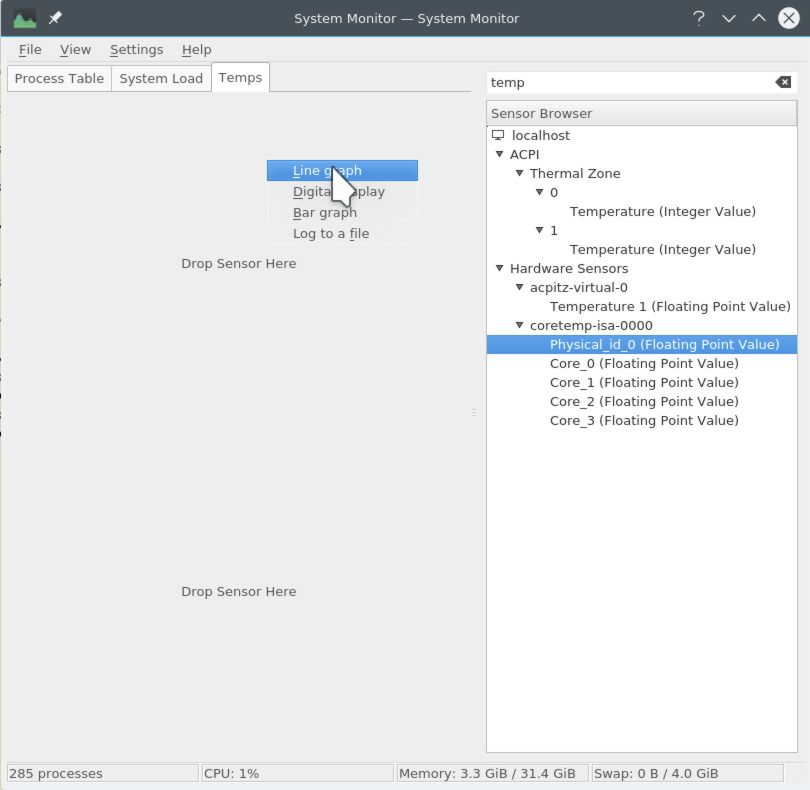
Once we select Line graph we are presented with just that.
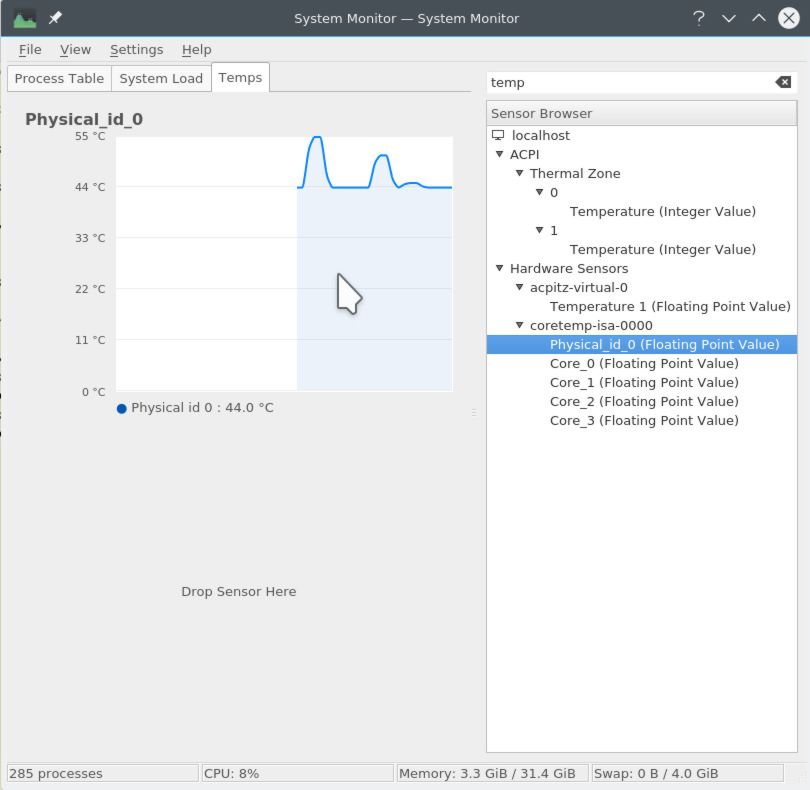
However, we’d like to standardize this graph to work of our expected data. We
can select Properties from the right-click menu to adjust the graphing
paramters:
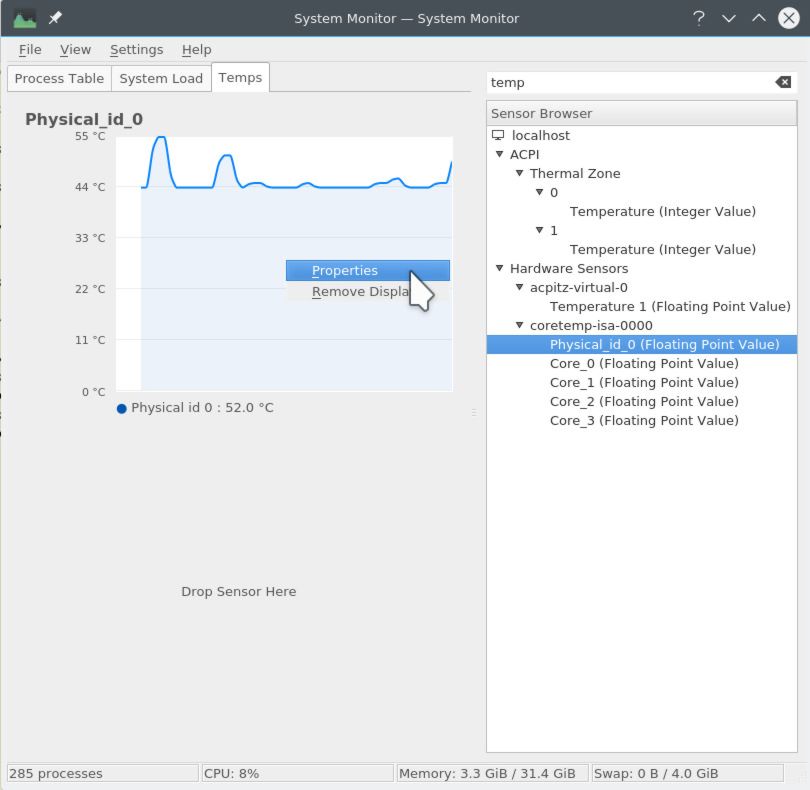
Now we will adjust our graph. The first image shows the default presentation.
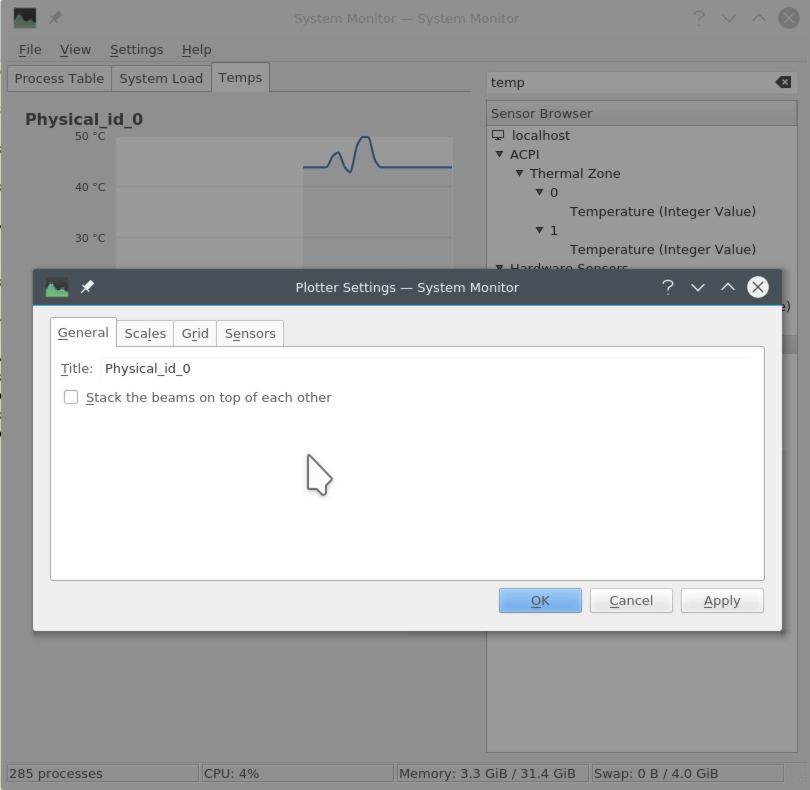
Our first task is to rename this graph to something a little more useful:
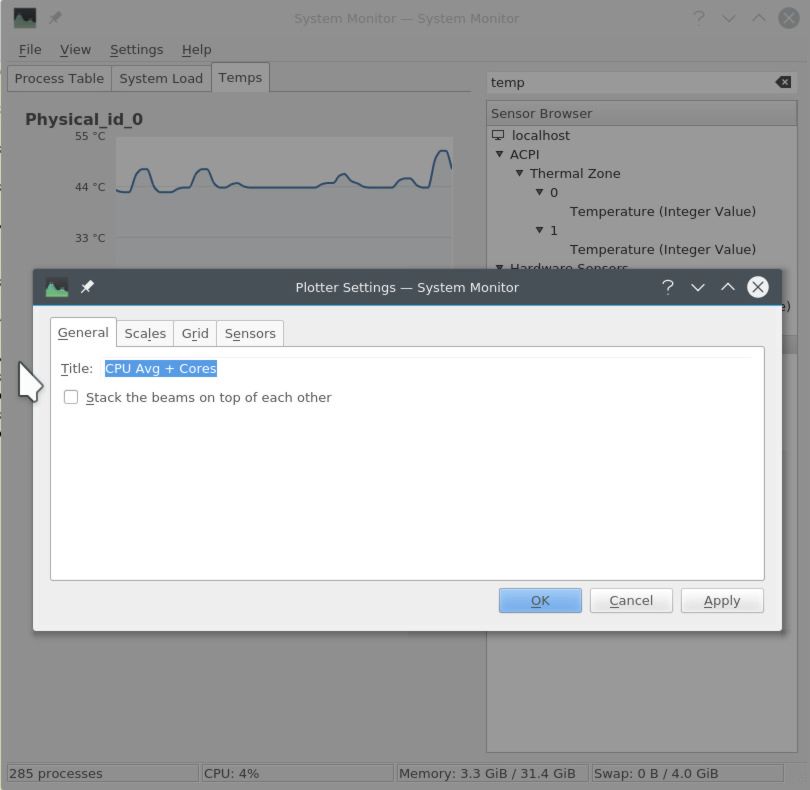
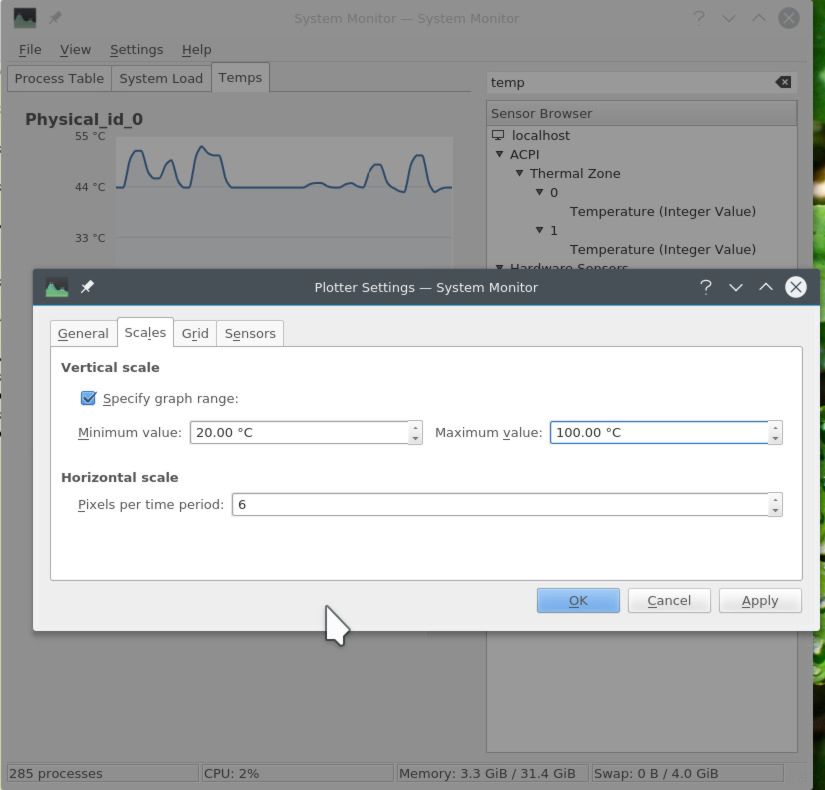
Now we specify a reasonable temperature range. A fixed range is desirable to prevent human errors.
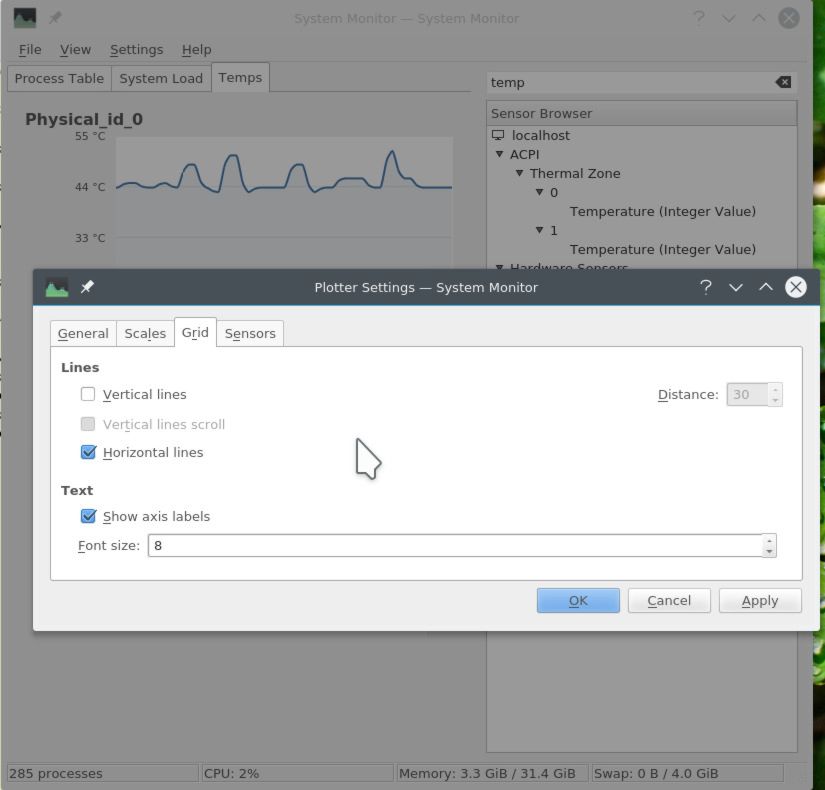
We leave the grid details as we found them:
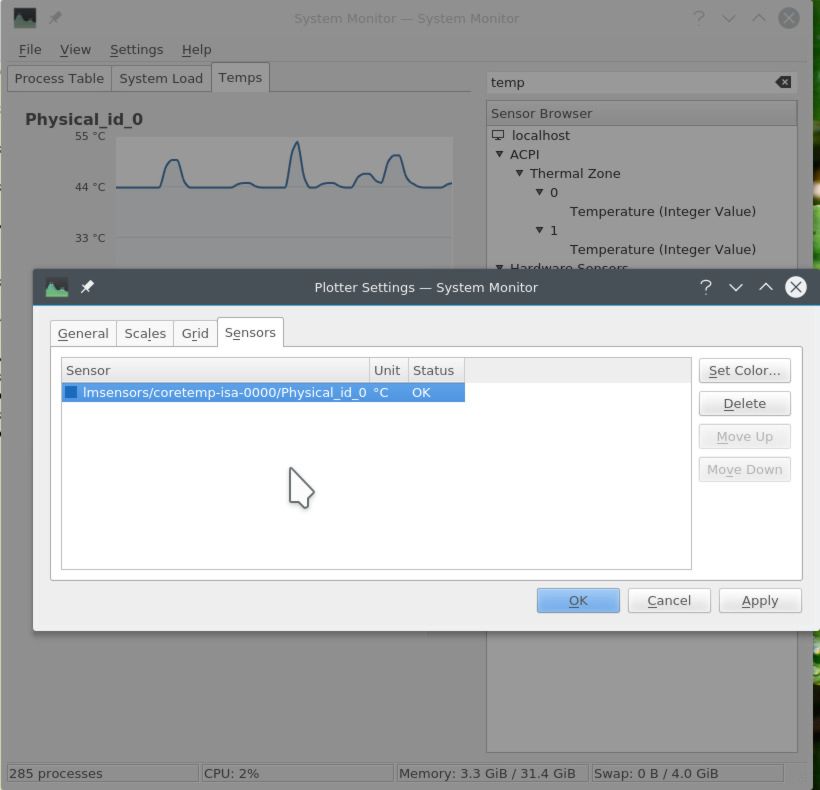
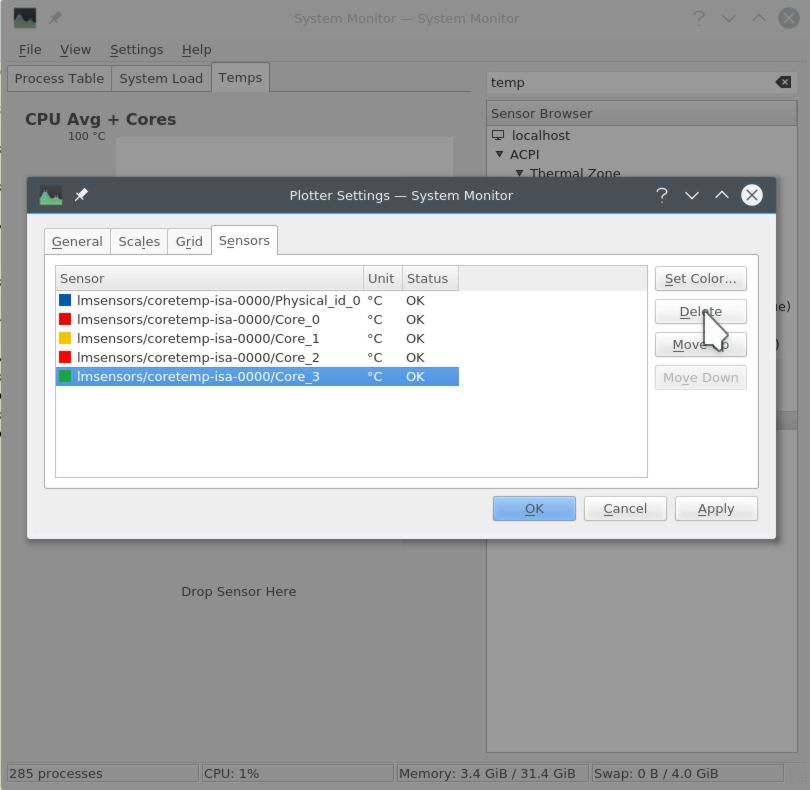
We also leave our first sensor as we find it. However, if we wanted to change the color or change the precidence of this value, we would do it here:
And here we are, our first CPU temperature monitor has been added. It appears this sensor shows the overall CPU temperature.
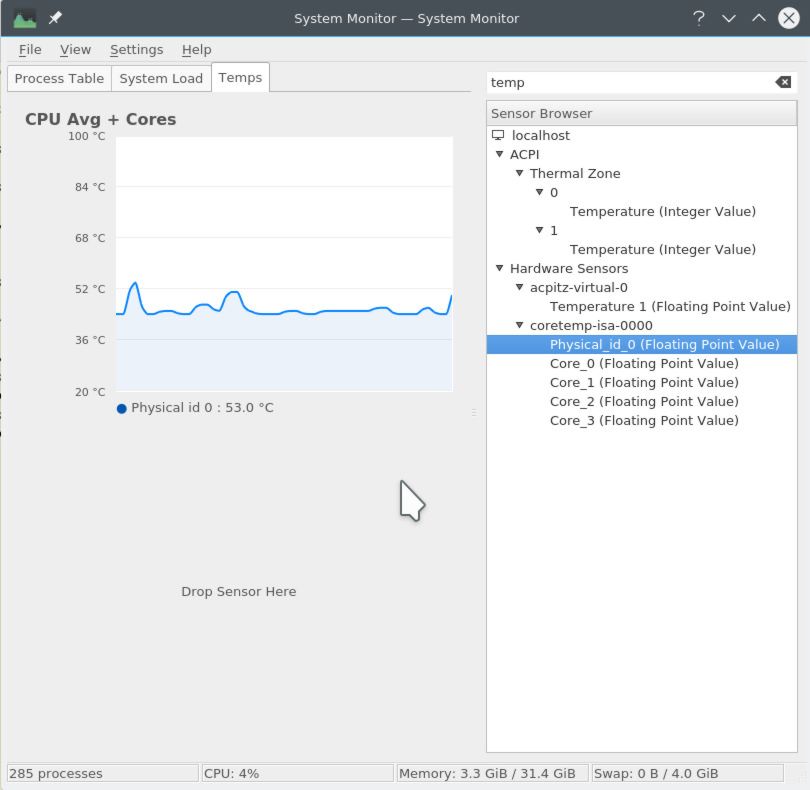
Now we can add the individual cores. We start with Core 0 and drag it to the existing graph:
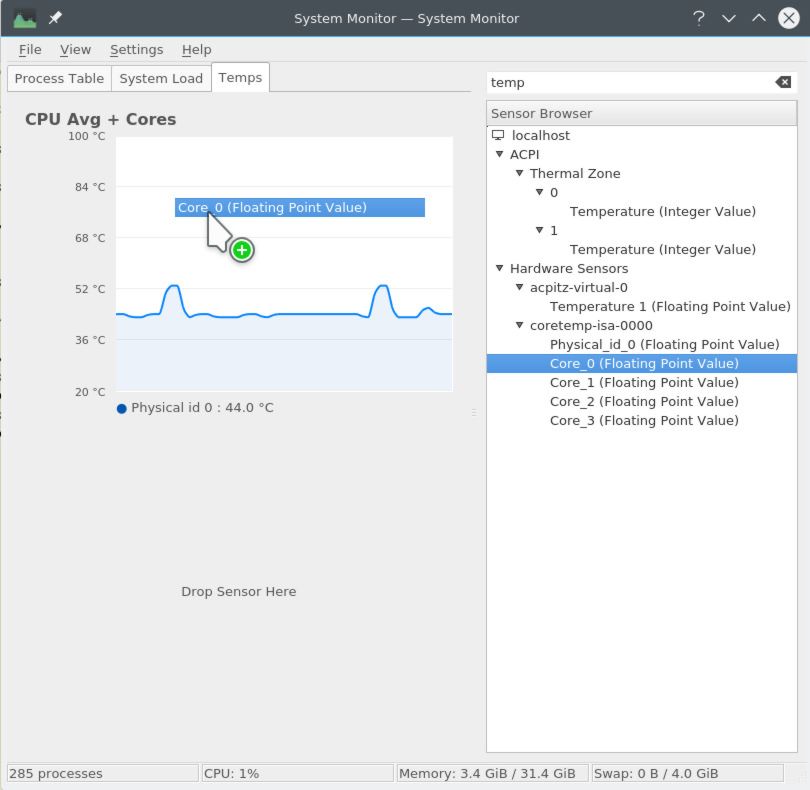
And we follow up with the other cores:
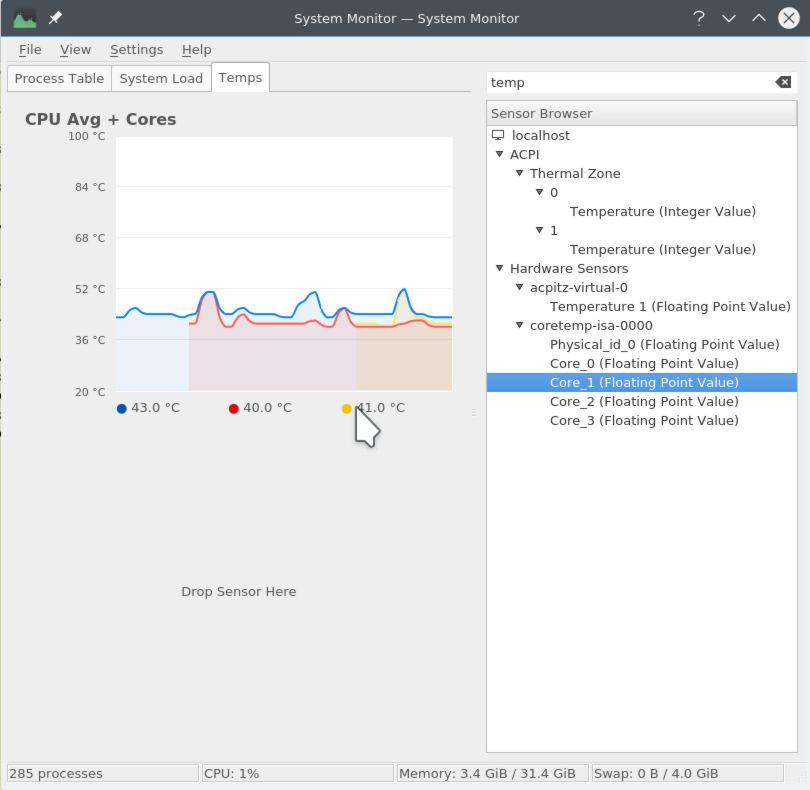
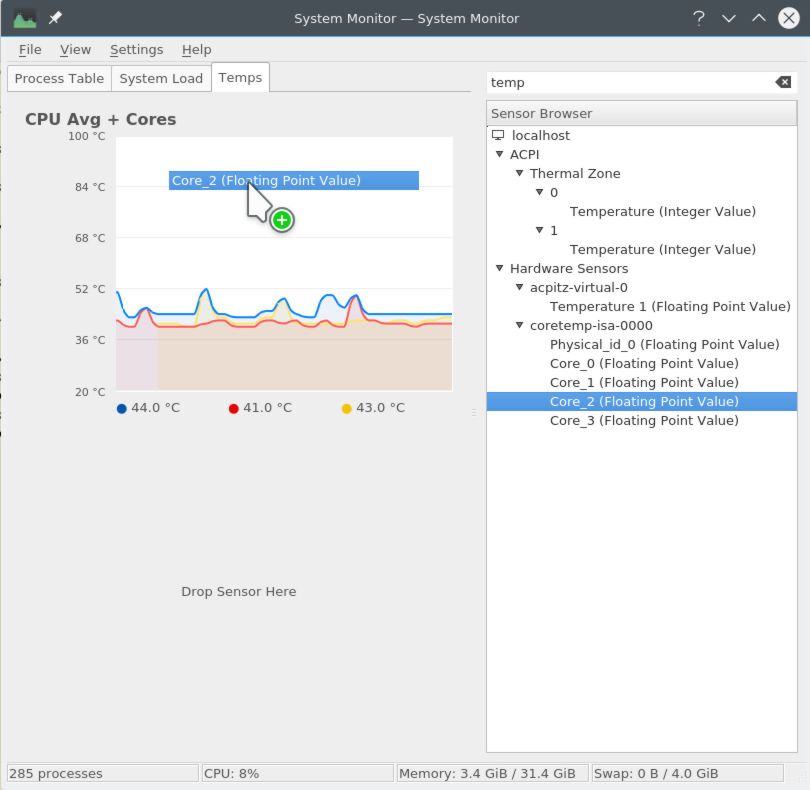
When we are finished, we can see that we have added 5 sensors total to this graph, and it is quite useful!
Now let’s tackle the GPU and System graph.
Add the GPU + System graph
Graphing the GPU temperatures is similar to graphing the CPU. However, its is a little more prone to error, as it’s not always apparent what sensor applies to which. I discovered which temperature correlated with actual GPU temperature by using the Uningine Heaven benchmark.
First we drag the temperature sensor from thermal zone 0 to our other graph:
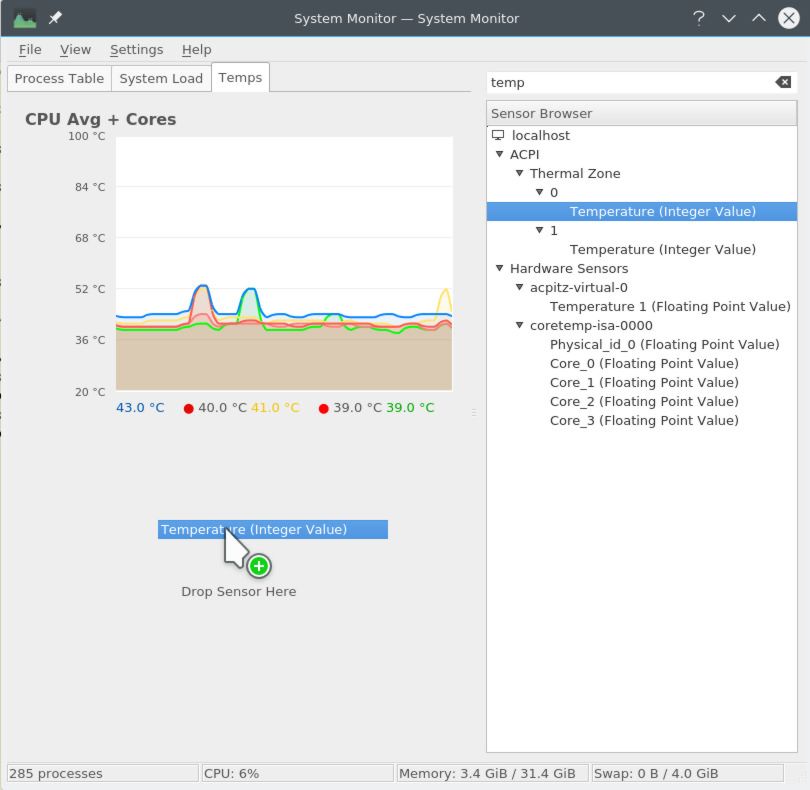
Again select a line graph:
And here is how it first looks:
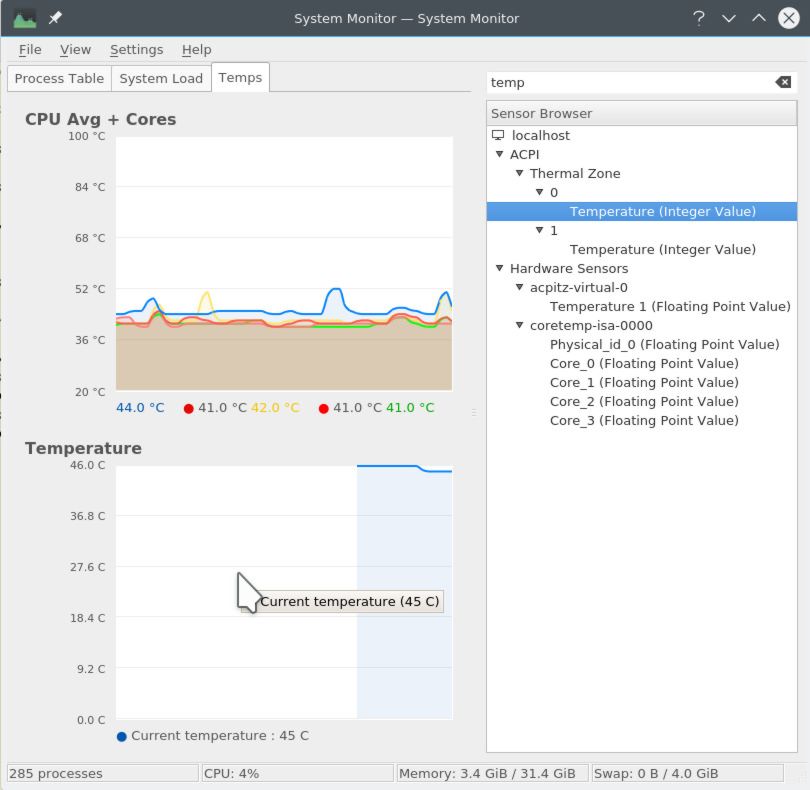
As with the CPU graph, we’d like to adjust the scale and titles.
We again use the properties right-click menu to set the temperature
scale:
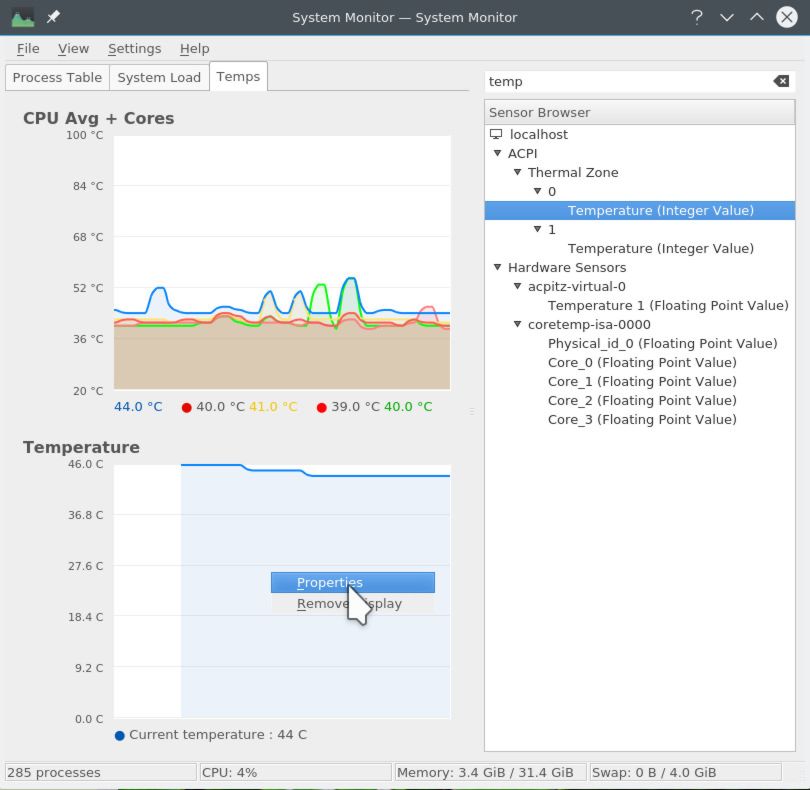
After adjusting the setting, notice how comparisons between the two graphs are now much easier:
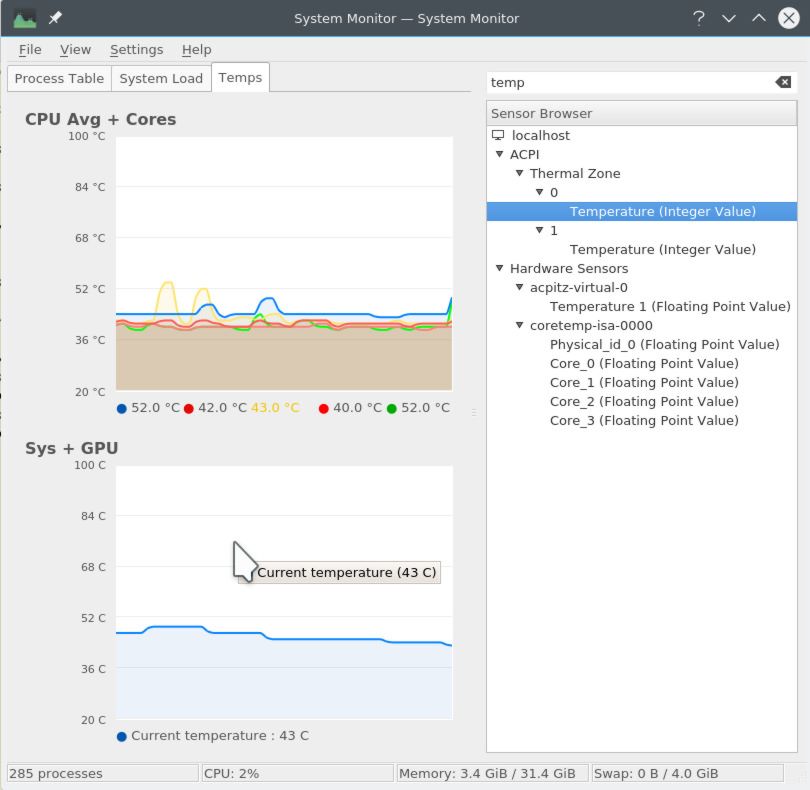
And we can now drag and drop our second sensor into the graph:
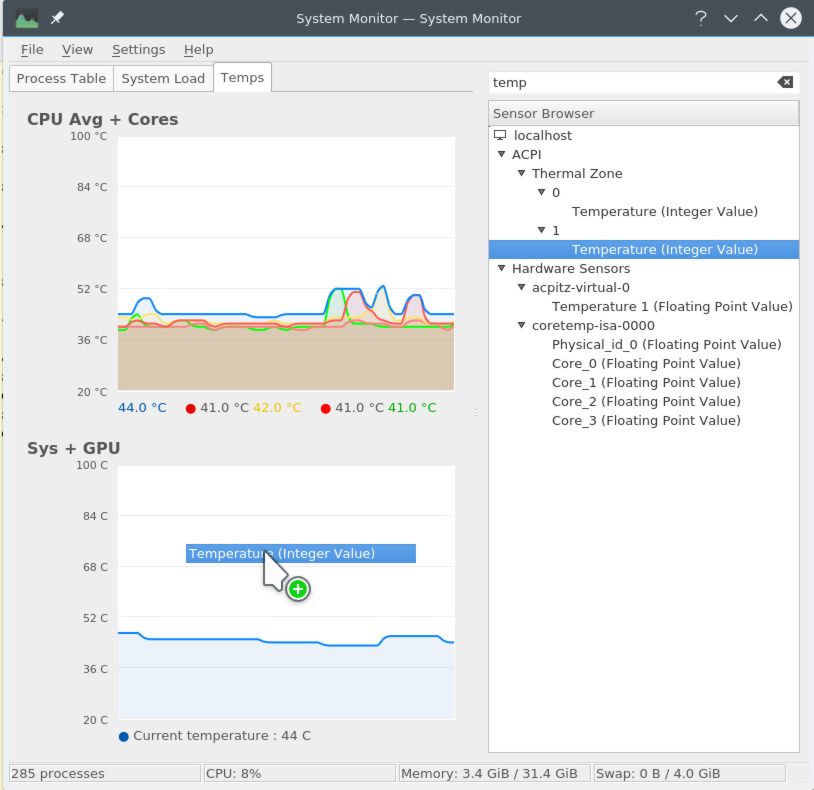
And there you have it, a nice tab that provides a good summary of important system temperatures!
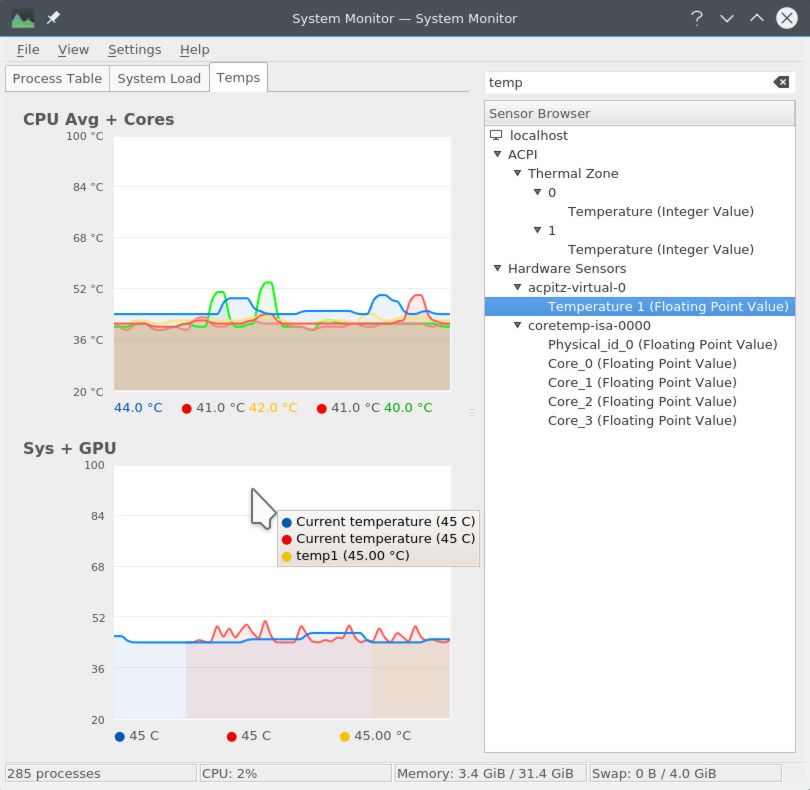
You can increase the number of available sensors by installing the lm-sensors package. Oh, and there is good news about my laptop: neither the CPU or the GPU was exceeding 60C even under heavy load.
As always, I hope you found this useful!
Cheers, Mike
Footnotes
* Yes, I know that technically there isn’t a “KDE 5 desktop”. For the pedandtic turds in the crowd, I’m running Plasma 5.5 / KDE Frameworks 5.15.0 / KDE applications 5.0.8. There, happy now?↩
